New Signal Strength Data (H1 2023)
Stetson Doggett•
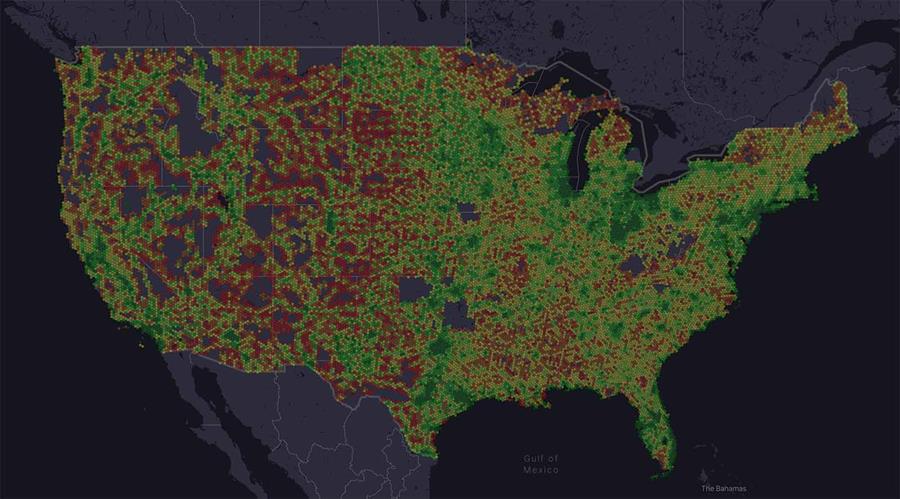
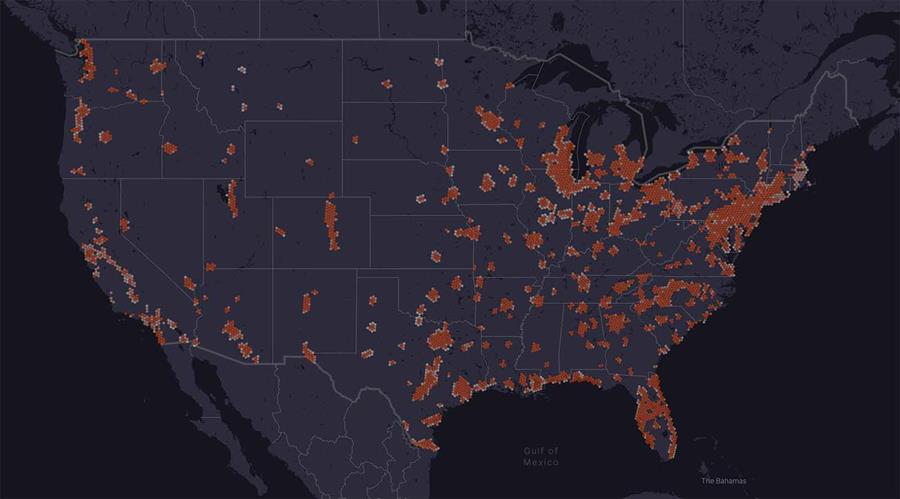
Today, we are excited to announce new Signal Strength Maps are here!
The Signal Strength Maps are built with data from the FCC.
On November 17, the FCC released its latest batch of signal strength data. The data was collected as of June 30, 2023, and includes updates to LTE and 5G coverage areas for Verizon, AT&T, and T-Mobile.
It also has a massive update to Dish's 5G network.
Check out the new signal strength maps now on the website, the iPhone app, or the Android app.
Verizon Coverage Changes
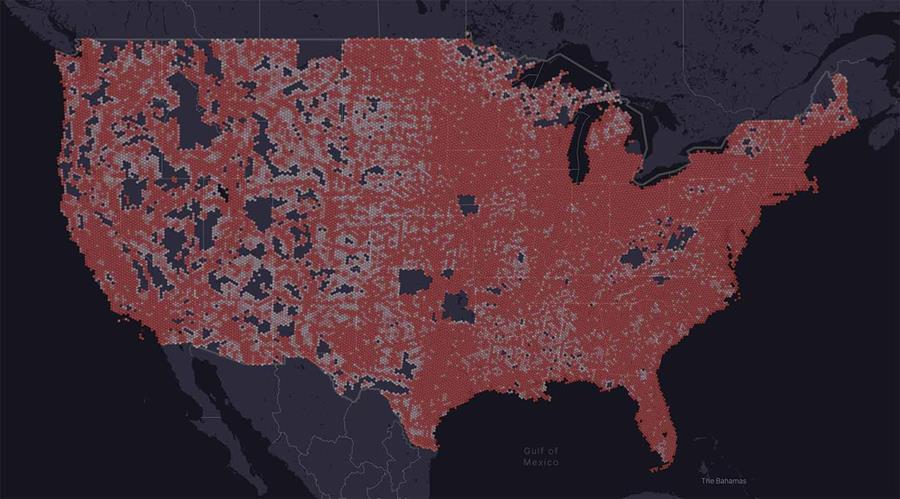
- Verizon's total coverage area increased from 55.05% to 55.90%
- Verizon's 5G coverage area dropped from 12.08% to 11.25%
- Verizon's 5G coverage area with speeds of 35 Mbps down and 3 Mbps up increased from 8.11% to 8.12%
AT&T Coverage Changes
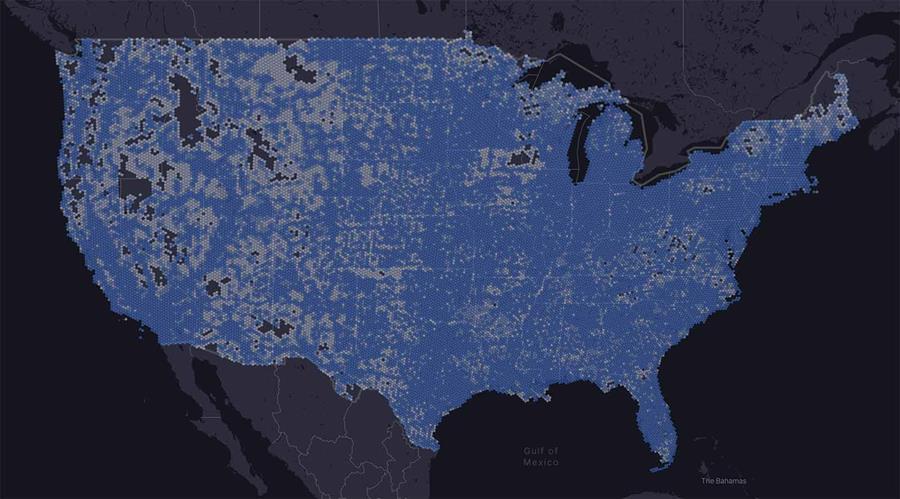
- AT&T's total coverage area increased from 55.11% to 56.95%
- AT&T's 5G coverage area increased from 31.49% to 31.67%
- AT&T's 5G coverage area with speeds of 35 Mbps down and 3 Mbps up increased from 10.92% to 12.55%
T-Mobile Coverage Changes
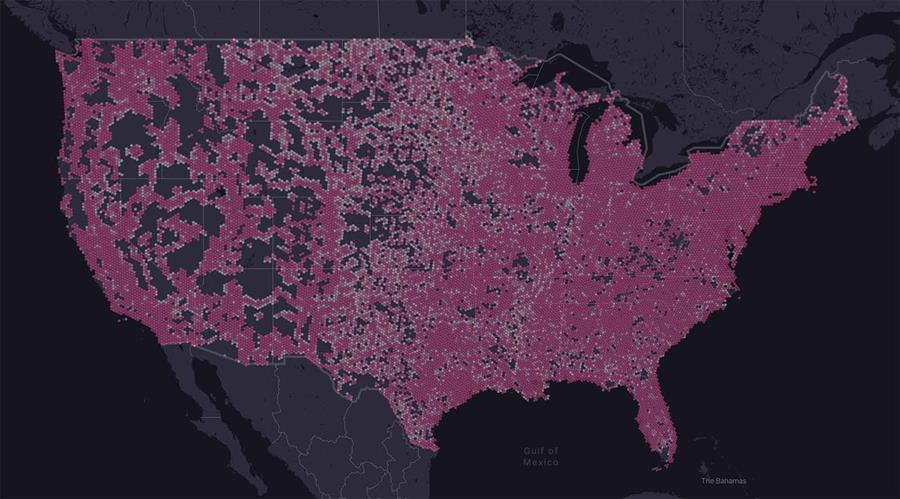
- T-Mobile's total coverage area increased from 35.30% to 35.31%
- T-Mobile's 5G coverage area increased from 26.25% to 27.29%
- T-Mobile's 5G coverage area with speeds of 35 Mbps down and 3 Mbps up increased from 14.82% to 15.54%
Dish Coverage Changes
- Dish's total coverage area increased from 3.46% to 7.53%
- Dish's 5G coverage area with speeds of 35 Mbps down and 3 Mbps up increased from 2.60% to 6.42%
This is the best look we have had at Dish's coverage map to date.