New Coverage Report Map Brings Data-Driven Reports of Cellular Performance In Every ZIP Code
Have you ever wanted a detailed analysis of cellular performance in your area?
An analysis with percentages of excellent, great, good, poor and no coverage for each carrier? Median download and upload speeds? Speed distribution curves? And even how performance changes based on time of day?
Today, we are excited to announce our new Coverage Report Map that brings you these features.
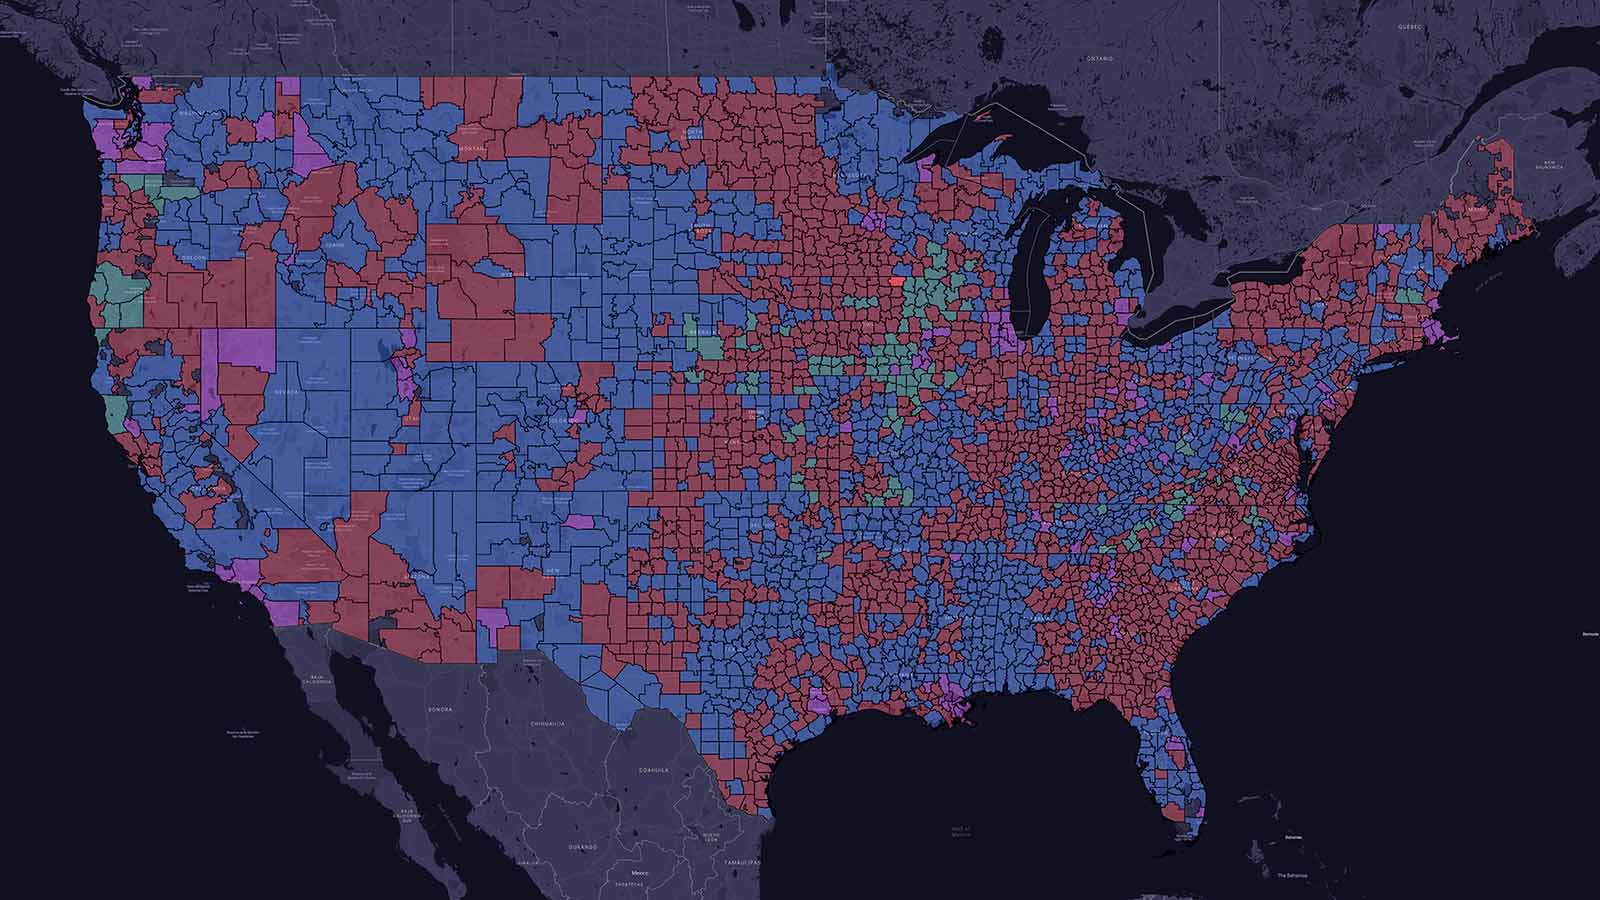
The Coverage Report map is a map of the United States where you can select any state, county, city, or ZIP code.
When you click on an area, you get a data-driven report of the cellular performance in that area.
Coverage Report for the state of Maryland
Each report includes the following details:
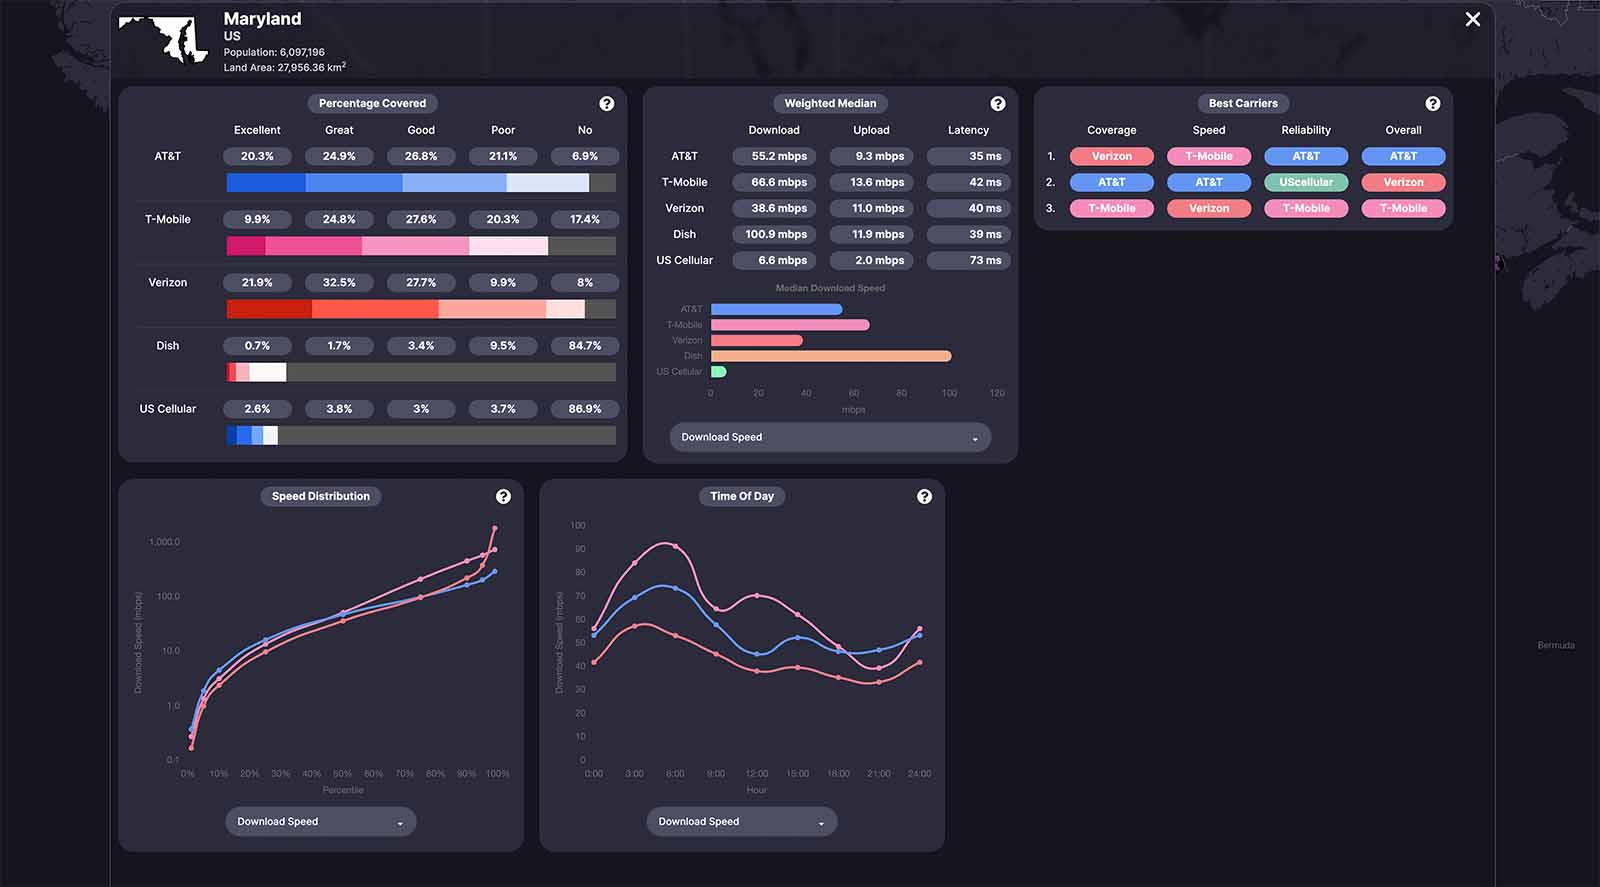
Percentage Covered
Percentage covered tells you how much coverage each carrier has in a given area, broken down by excellent, great, good, poor, and none.
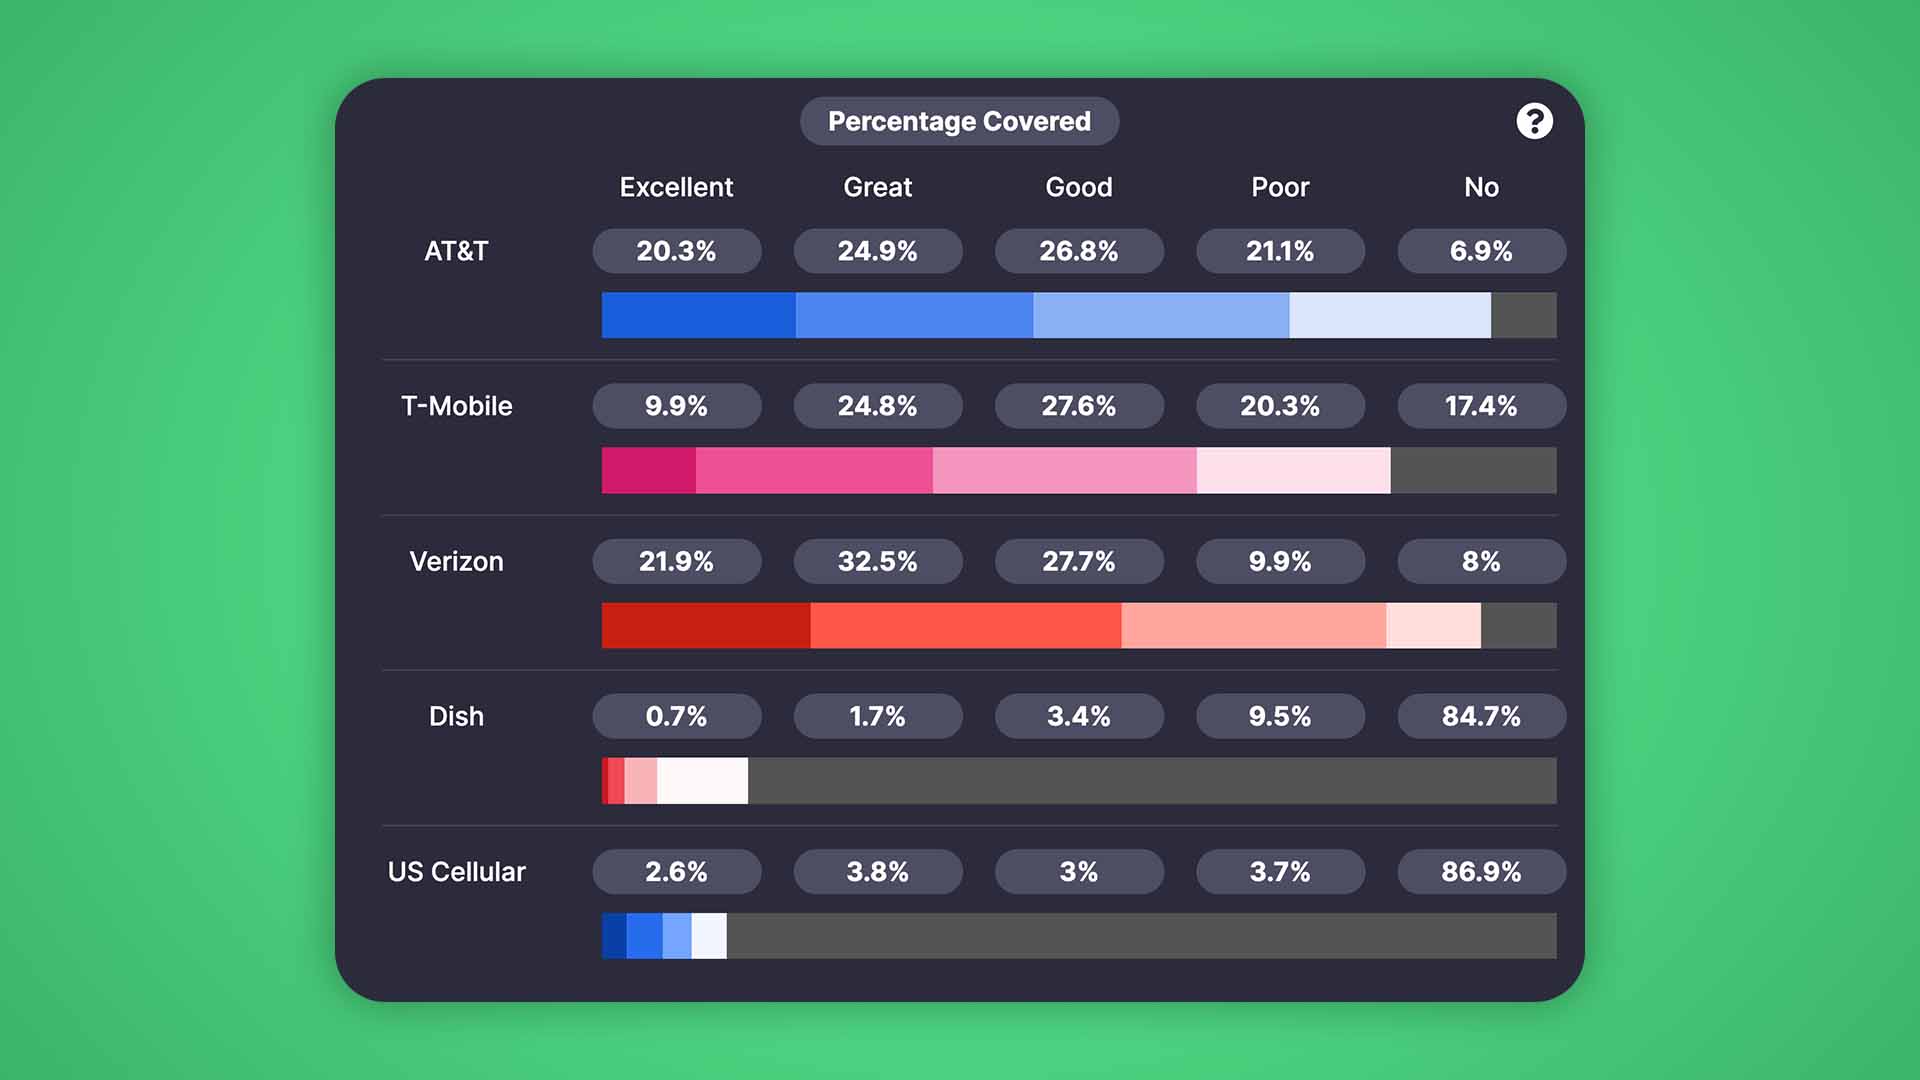
Weighted Median Performance
The weighted median performance eliminates outlier results and reveals real-world download speeds, upload speeds, and latency.
Best Carriers
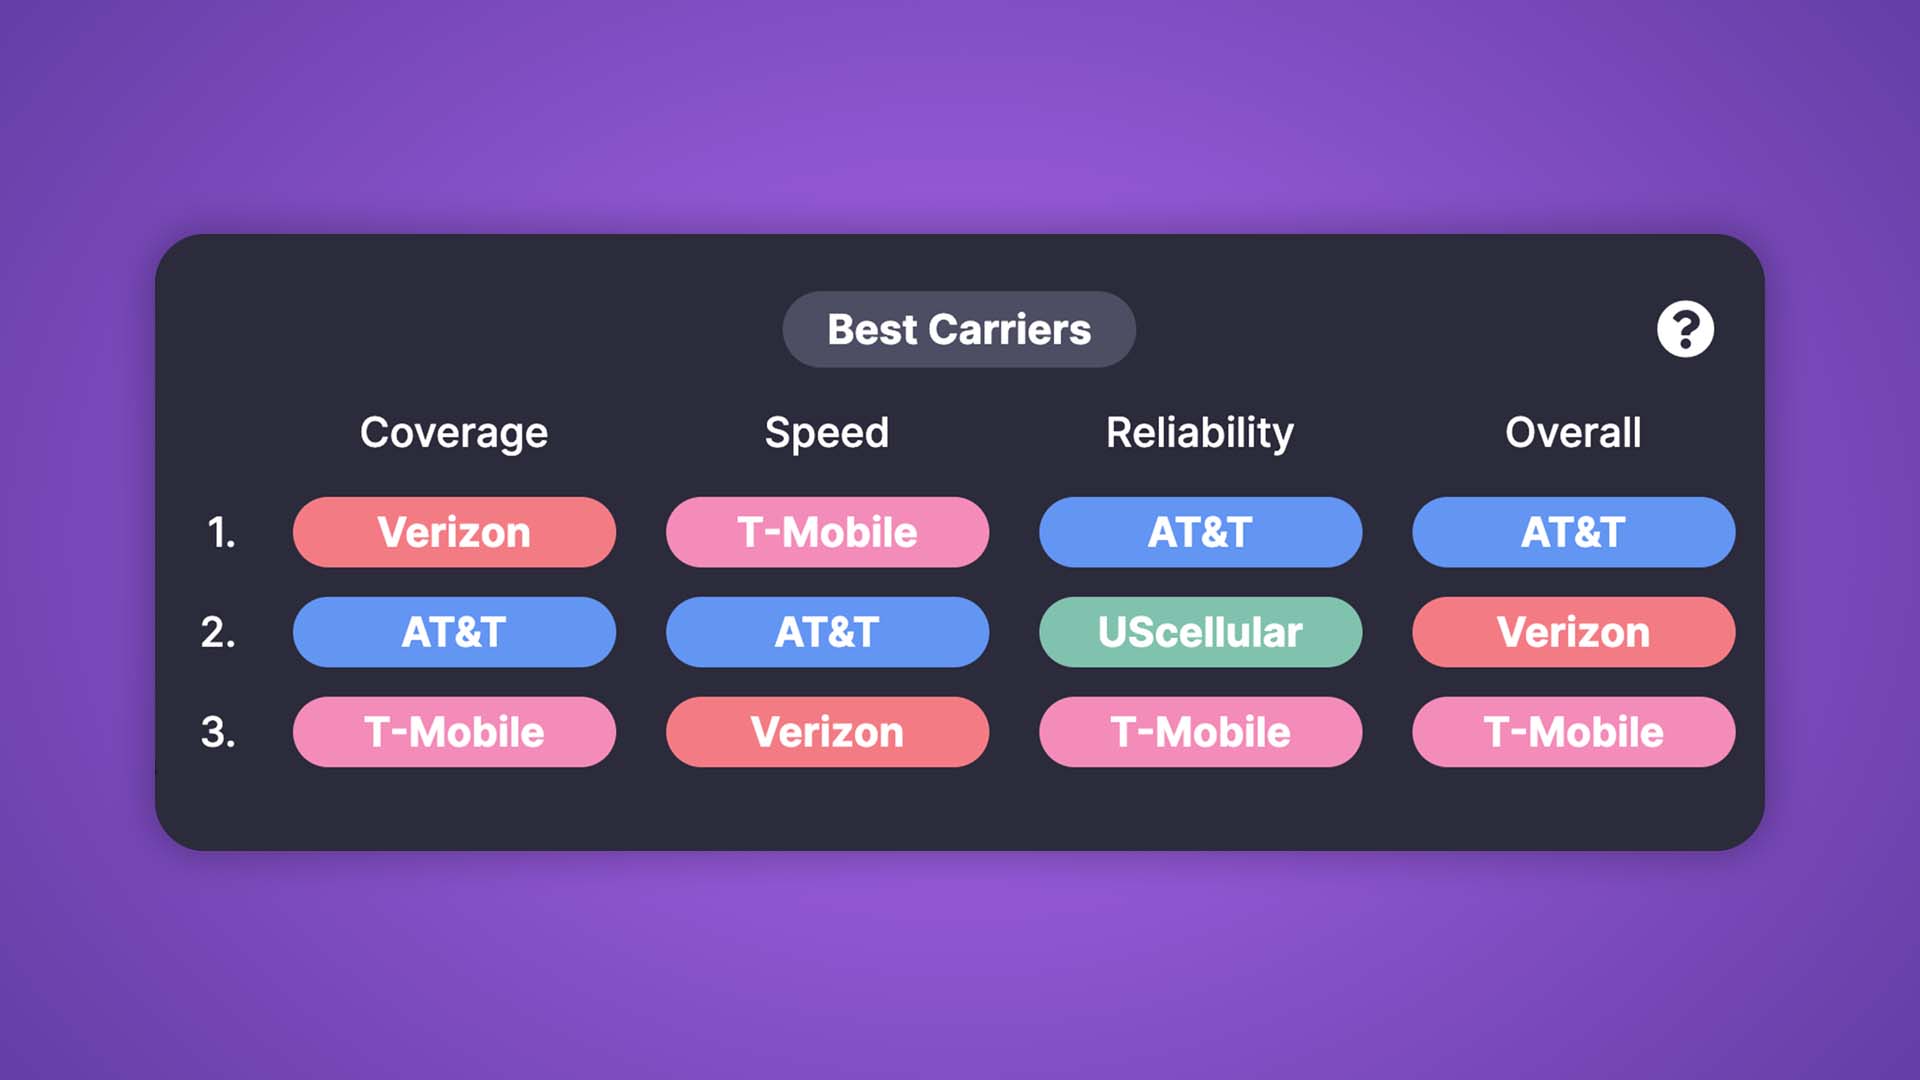
The best carriers section ranks carriers for coverage, speed, reliability, and overall performance.
Speed Distribution
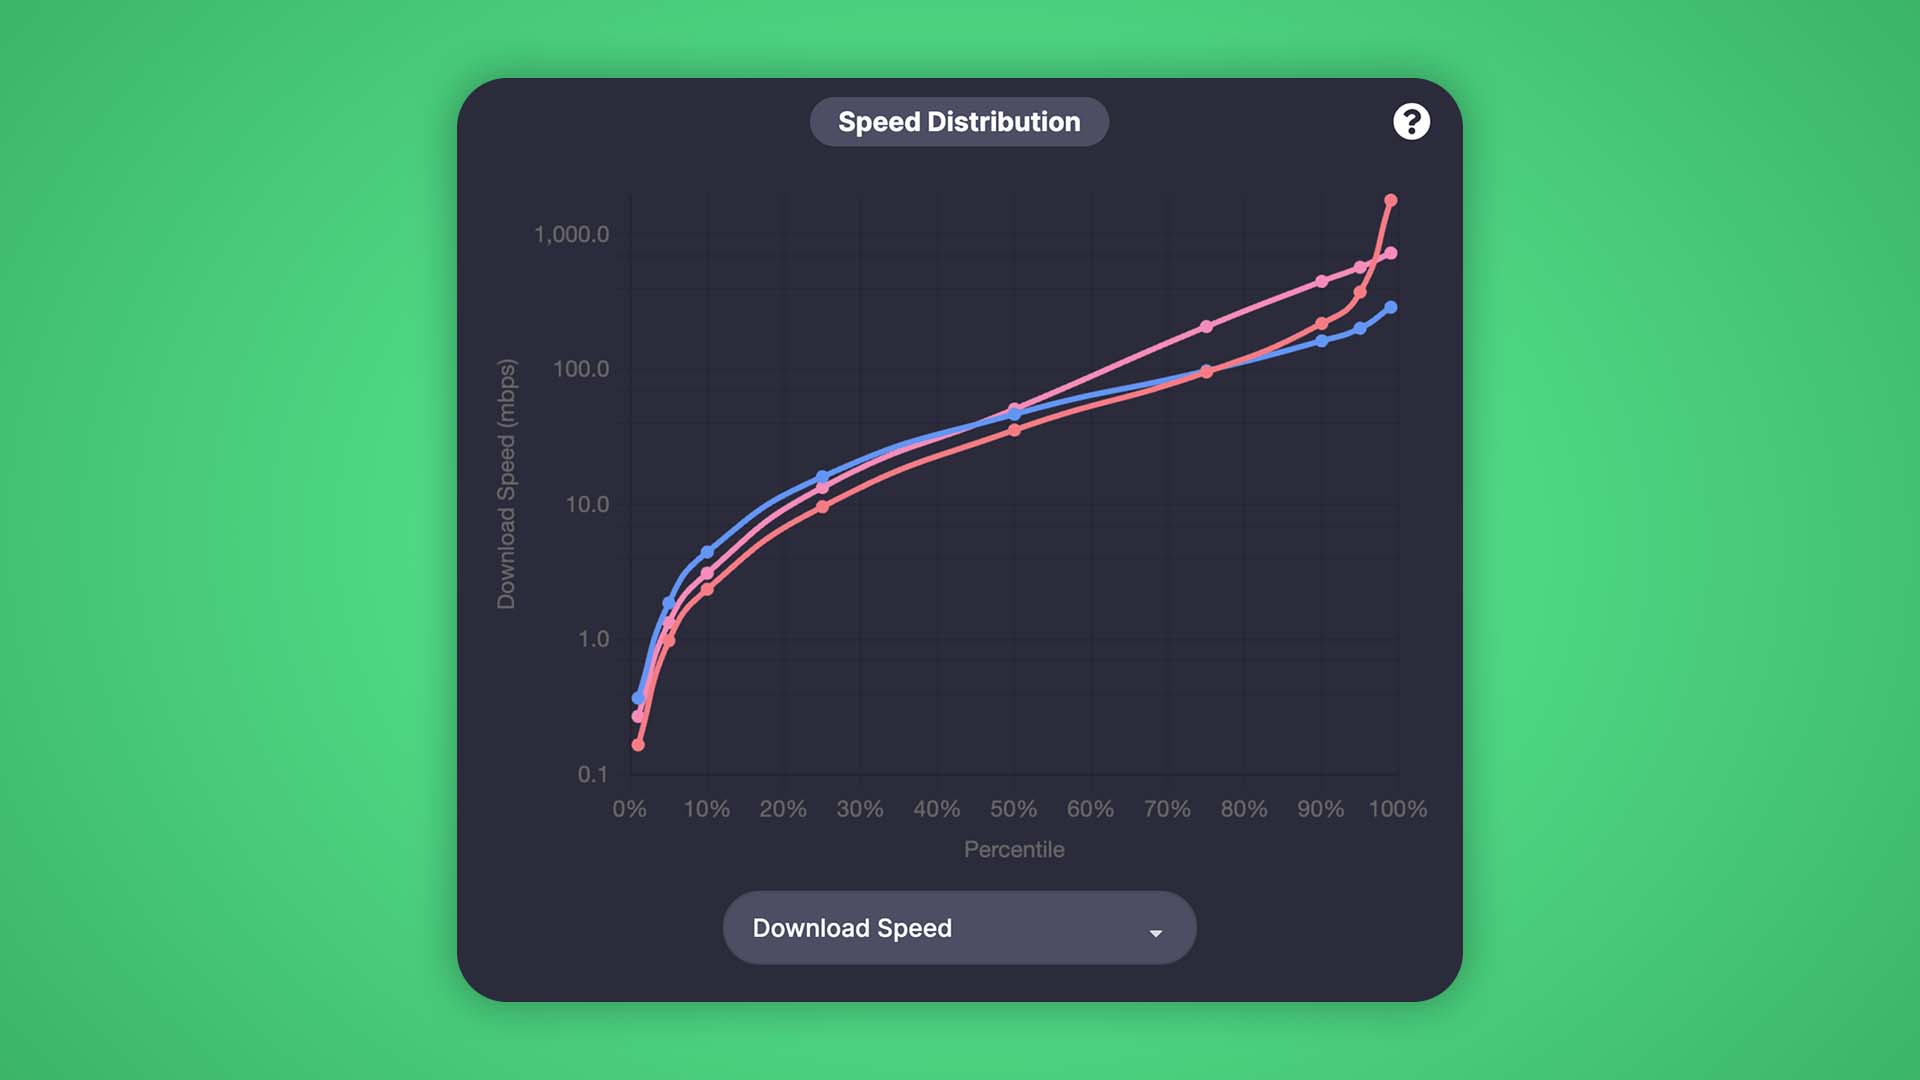
The speed distribution graph is one of the best ways to compare performance between carriers at a glance.
Time of Day Performance
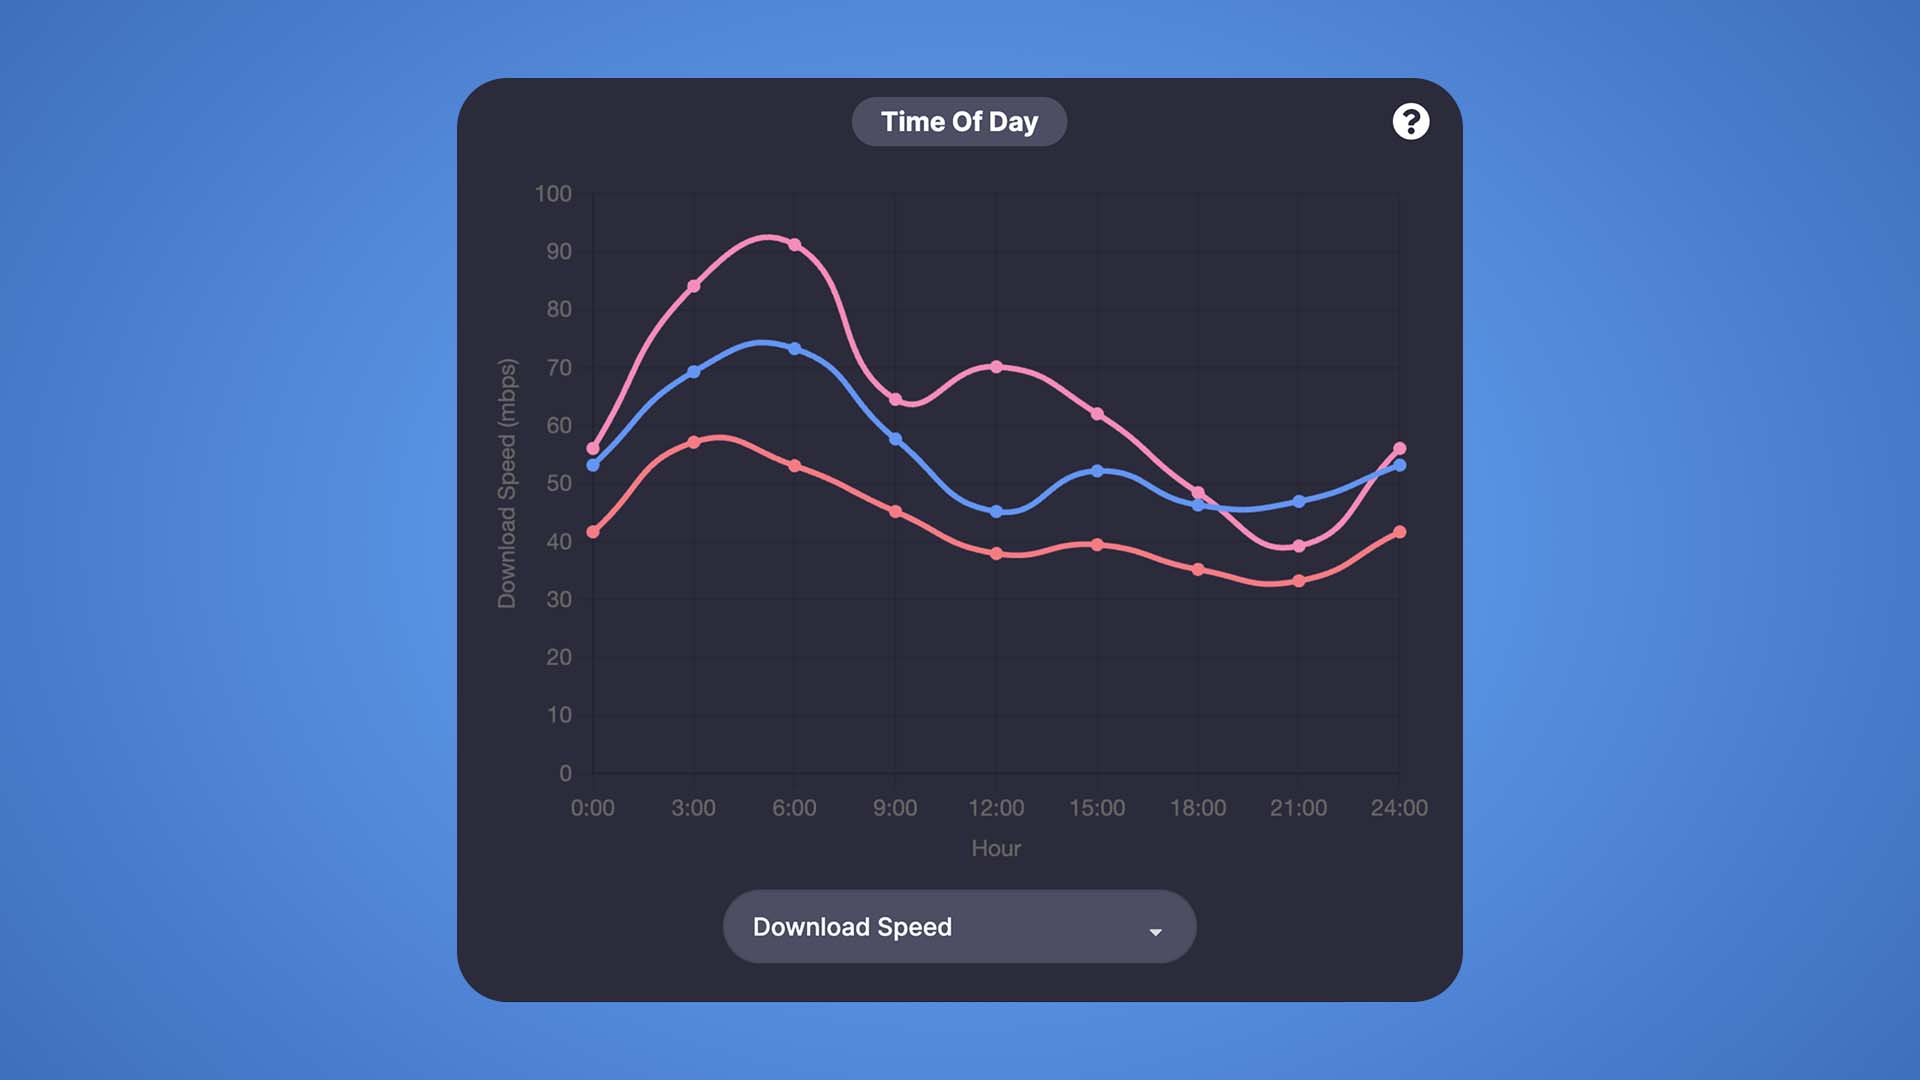
The time of day graph shows how cellular speeds fluctuate based on the time of day.
Have you ever seen this before?
- A breakdown of percentage covered by each carrier, including excellent, great, good, poor, and none ratings
- Weighted median results for download speeds, upload speeds, and latency
- Rankings based on coverage, speed, reliability, and overall performance to identify the #1 carrier
- A speed distribution chart for comparing download, upload, and latency
- A graph of cellular performance based on time of day
How can I access the Coverage Report Map?
The Coverage Report Map is included at no extra charge in the CoverageMap Pro subscription.
If you are already a CoverageMap Pro member, you can view the map here.
Where does this data come from?
The data comes from over 2.5 million speed tests uploaded to the Speed Test Map along with coverage data provided by the FCC.
We worked hard to bring you this map. Trevor put in over 127 hours to build it.
We hope you love it and consider supporting us with CoverageMap Pro.